Chapter 23 of 25 — contents
- 01What a Trading Engine Actually Is
- 02qkt as a Subject
- 03The Event Bus
- 04Candles
- 05Position Tracking and P&L
- 06The Risk Engine
- 07Exact Arithmetic
- 08Deterministic Replay
- 09Backtest Reporting
- 10Parameter Sweeps and Walk-Forward Analysis
- 11Backtest Fidelity
- 12Why a DSL
- 13Parsing and Compiling
- 14Indicators
- 15Historical Data
- 16The Live Runtime
- 17Brokers
- 18The Order Lifecycle
- 19Resilience
- 20Backtest/Live Parity
- 21Portfolios
- 22Observability
- 23Performance
- 24One Strategy, End to End
- 25What Building qkt Teaches About Trading Systems in General
Performance
Where the time actually goes#
It would be easy to assume a trading engine’s performance story is about speed in the way a benchmark means it — microseconds to a venue, a race against somebody else’s machine.
For most of what qkt does, that is the wrong frame. It is not competing to be first to a price. What it needs is more modest and more continuous: keep up. Process every tick, run every subscriber, sweep every live order, re-price every open position — and do it again before the next tick arrives, for weeks, without the memory footprint growing.
That reframes the problem. The enemy is not latency in the abstract. It is work that scales with something it shouldn’t, and garbage created on a path that runs millions of times a day.
The same four things, every tick#
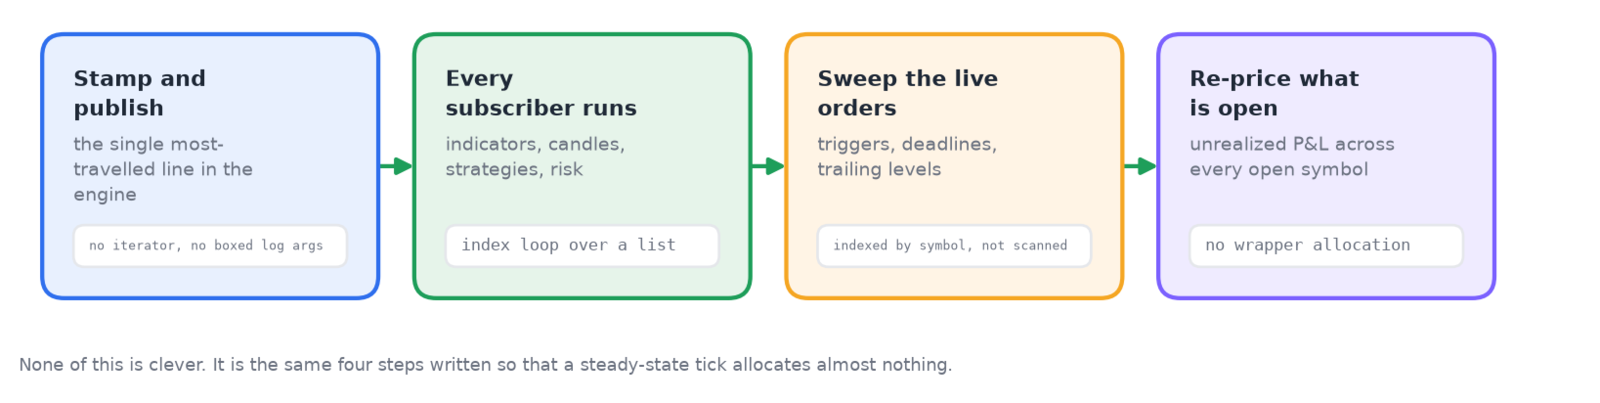
Figure 23.1 — the hot path. Nothing here is clever; it is ordinary work written so that a steady-state tick allocates almost nothing.
A tick arrives, gets stamped and published, every subscriber runs, live orders are swept for triggers and deadlines, and open positions are re-priced for unrealized P&L. That is the loop. The optimisations are all in how those four things are written, and they fall into a small number of repeated patterns.
Both of the first two are visible in about eight lines of the event bus:
// Guarded: publish is the engine's hottest line. Unguarded, the two Long args box and a
// vararg Object[] allocates on every publish even when trace is off; the guard skips all of
// that. Output is unchanged when trace is enabled.
if (log.isTraceEnabled) {
    log.trace("publish {} seq={} ts={}", stamped::class.simpleName, stamped.sequenceId, stamped.timestamp)
}

// Index loop over the handler list (the single most-traversed line in the engine) avoids
// allocating an Iterator per published event.
val handlers = subscribers[stamped.javaClass].orEmpty()
for (i in handlers.indices) {
    handlers[i](stamped)
}
Do not build what you will not read. That if looks pointless — the
logging framework would discard the line anyway. But evaluating the
arguments happens first, regardless: the two Longs get wrapped into
objects (Java cannot put a primitive in an Object[]), and a varargs
array is allocated to carry them. Three allocations per published event,
thrown away immediately, in production where trace is always off. The
guard skips the whole thing.
Do not allocate to iterate. for (h in handlers) would create an
iterator object on every publish. for (i in handlers.indices) walks the
same list with an integer. Identical behaviour, one fewer object per
event, on the line that runs more than any other in the system.
Neither is clever. Both are the sort of thing that is invisible at one call and dominant at ten million.
Reuse the scratch space. The per-tick order sweep fills reusable lists rather than new ones, because clearing a list keeps its capacity — so after the first few ticks, steady-state list allocation on that path is zero. This works only because of Chapter 16’s single-thread rule: shared scratch buffers are safe precisely because the sweep is never running twice at once. It is a direct dividend of a decision made for determinism.
Index instead of scanning. Live orders are bucketed by symbol, so a tick only touches orders on its symbol, and per-tick cost stays flat as more symbols and strategies are added rather than growing with the total. Orders carrying a deadline get their own separate index, for a reason with a satisfyingly specific diagnosis: most orders are good-till-cancelled, so walking the entire live set just to discover most of them have no deadline was the dominant cost of a bar-replay backtest.
Offer a cheaper twin. This is the most characteristic pattern in the codebase. Where a general method returns a rich result — a converted amount wrapped in currency and conversion metadata — there is a second method returning just the number, for the per-tick path that only needs the number. On a same-currency account the wrapper churn dominated the allocation profile of the unrealized-P&L walk, so the walk calls the twin. The same shape appears for reading positions without copying the map, and for iterating symbols without materialising a list.
That twin pattern carries a real risk, and the source names it rather than hiding it: the two methods must stay behaviourally identical, and that equivalence is guaranteed by a documented contract rather than by shared code. It is a maintenance obligation accepted deliberately, in exchange for not paying wrapper allocation on every tick of every open symbol.
There is a small one worth including because of how specific it is: a currency-code check that was a regular expression became a character check, because compiling the pattern and allocating a matcher — on every money value constructed, on every tick — was measurably dominating the backtest hot path. Regular expressions are fine. Regular expressions on a path that runs a hundred million times are a design decision.
Correctness that costs, and is paid anyway#
It matters that not everything on this path is optimised, and the places that aren’t are the more interesting story.
Event dispatch still runs every subscriber even after one throws, collecting the first failure and re-raising it afterwards. That is slower than stopping. It is kept because Chapter 3’s argument holds: a fill that mutated the venue but never reached the book-applier leaves the engine permanently diverged, and a fast wrong answer is not an improvement.
Off-thread publishes are routed through a queue so that stamping stays single-threaded, which costs a hop that a lock-free multi-writer design would not. It is kept because the sequence numbers it protects are what make a replay reproduce.
And the biggest one, from Chapter 8: the backtest runs the full production path — event bus, virtual dispatch, risk engine, order manager — when a purpose-built vectorised backtester would be an order of magnitude quicker. That is the largest single performance cost in the system, paid in full, every run, to avoid a second implementation that could drift.
The pattern across all three: performance is spent freely on ordinary work, and never at the expense of an invariant. When those conflict, the invariant wins and the cost is documented.
Measuring without disturbing#
Which brings up the measurement problem. At a few thousand ticks a second, naive instrumentation is not free — allocating a list or taking a lock per sample would cost more than the thing being measured.
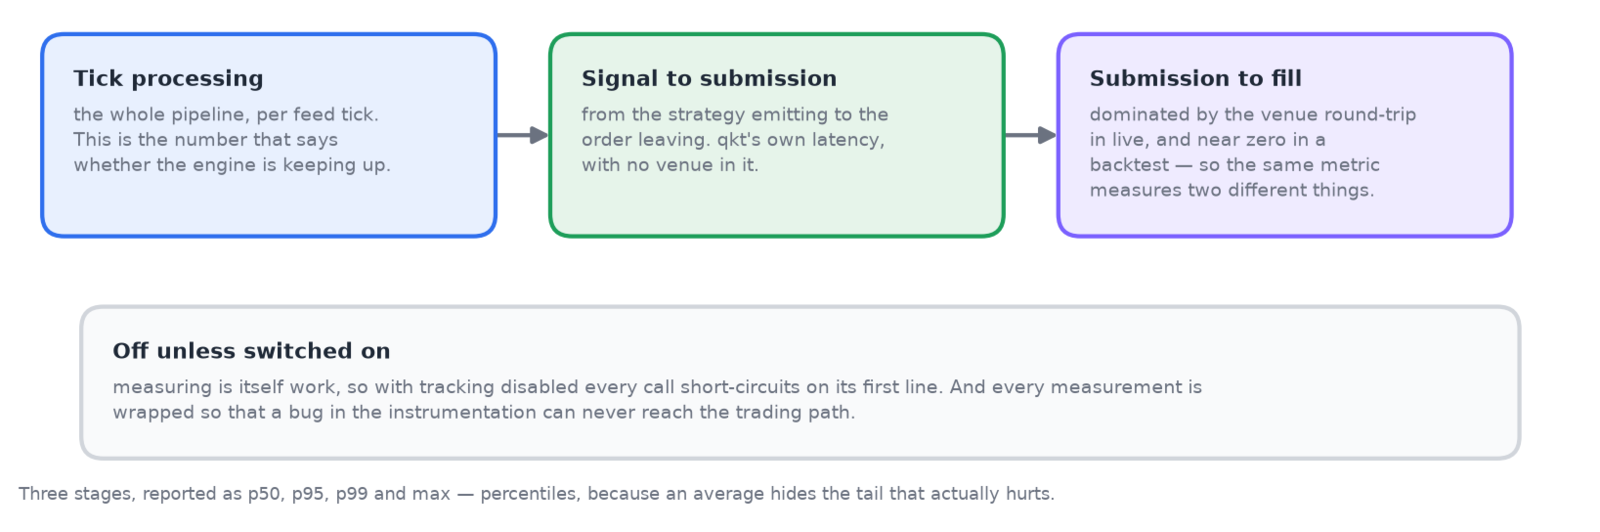
Figure 23.2 — what is timed, and the two rules that keep timing from becoming the problem.
Three stages are timed. Tick processing is the whole pipeline per feed tick — the number that answers “is the engine keeping up.” Signal to submission measures from a strategy emitting to the order leaving, which is qkt’s own latency with no venue in it. Submission to fill covers the round trip, and is worth reading carefully because it measures two entirely different things in the two modes: venue latency in live, essentially nothing in a backtest.
Two rules keep the measurement honest. First, it is off unless explicitly enabled — with tracking disabled, every call short-circuits on its first line, with no allocation, no map lookup and no clock read. That is the path that runs in production unless an operator turns it on.
Second, every measurement is wrapped so that a failure inside the instrumentation cannot propagate. An observability bug must not be able to reach the trading path. The thing that watches must never be able to break the thing it watches.
The samples live in fixed-size ring buffers, and the pending-submission map that bridges the third stage is bounded and evicts oldest-first — so an order that never fills cannot leak, and a fill whose submission has been evicted is simply not counted rather than being an error.
Reported as percentiles rather than an average:
$ qkt status --latency

STRATEGY              STAGE                  COUNT     p50      p95      p99      MAX
momentum-btc          TICK_PROCESSING          500   12.3µs   45.1µs   80.0µs  120.4µs
An average would hide the tail entirely, and the tail is the part that matters — a mean of twelve microseconds is compatible with a hundred occasional excursions that each missed a bar close.
Cheap to run, harder to read#
What it bought is an engine whose per-tick cost is roughly flat as strategies and symbols are added, whose steady-state allocation on the hot path is close to zero, and which can be measured when someone needs to know why it is slow.
What it cost is legibility, in small amounts, in many places. An index loop is less readable than a for-each. A guarded log line is noisier than an unguarded one. A shared scratch buffer is a landmine if the single-thread assumption ever stops holding. And a cheaper twin method is a correctness obligation maintained by discipline.
Every one of those is defensible where it is, and defensible because it is documented at the site with the reason — which is the difference between an optimisation and a piece of cleverness somebody will delete in two years.
One honest note to close on: there is no benchmark suite in the repository. The performance claims in the source are stated as findings from profiling, not as reproducible measurements anyone can re-run. The optimisations are individually sound and their reasoning is sound, but “this dominated the hot path” is an assertion about a profile nobody else can see. For a system this careful about evidence everywhere else, that is the gap most worth naming.