Chapter 22 of 25 — contents
- 01What a Trading Engine Actually Is
- 02qkt as a Subject
- 03The Event Bus
- 04Candles
- 05Position Tracking and P&L
- 06The Risk Engine
- 07Exact Arithmetic
- 08Deterministic Replay
- 09Backtest Reporting
- 10Parameter Sweeps and Walk-Forward Analysis
- 11Backtest Fidelity
- 12Why a DSL
- 13Parsing and Compiling
- 14Indicators
- 15Historical Data
- 16The Live Runtime
- 17Brokers
- 18The Order Lifecycle
- 19Resilience
- 20Backtest/Live Parity
- 21Portfolios
- 22Observability
- 23Performance
- 24One Strategy, End to End
- 25What Building qkt Teaches About Trading Systems in General
Observability
The question that has no good answer at 3am#
A strategy has been running for six days. Someone looks at the account and a number is wrong — not catastrophically, just wrong enough that it cannot be ignored. The position is smaller than it should be, or a trade appears that nobody can explain.
Now answer this: what exactly happened, in order?
Every mechanism in this book exists to make the system behave correctly. This chapter is about the different problem of being able to find out what it did — after the fact, on a machine you are not attached to, about a moment that has passed. And the uncomfortable part is that the two goals are in tension. Recording everything costs time on the hot path. Recording nothing costs you the only evidence you will ever get.
Two journals, because there are two jobs#
qkt keeps two separate records, and the split is the most instructive decision in the chapter.
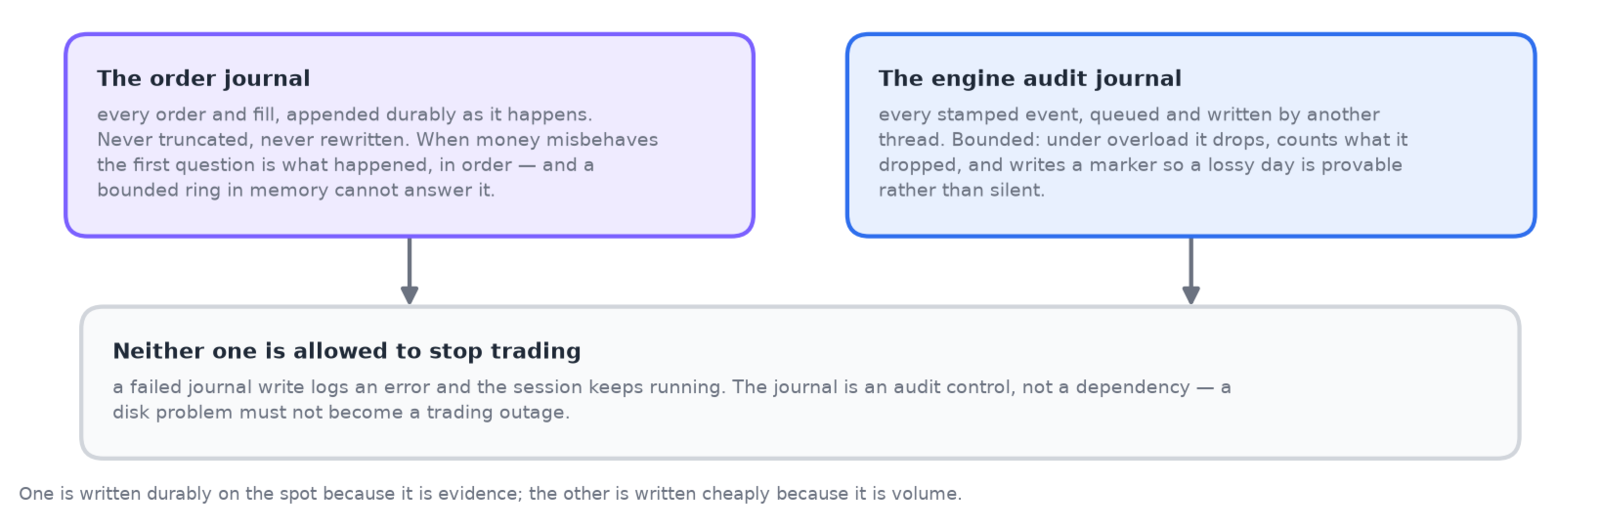
Figure 22.1 — one record is evidence and one is volume, and they are built to different standards on purpose.
The order journal records every order and fill, one line at a time, appended durably as it happens. Never truncated, never rewritten. The reasoning in the source is exactly the scenario this chapter opened with: when real money misbehaves, the first question is what happened in order, and a bounded ring buffer in memory cannot answer it.
Getting that cheap enough took a specific trick. Opening a file, writing a line, flushing it and closing it — per event — stalls the engine thread inside event dispatch, which by Chapter 16’s rules means it stalls trading. So the file handle is held open in a mode where a single append is itself durable. One write, no open/close cycle, and the evidence is on disk before the call returns.
The audit journal is the opposite trade. It records every event on the bus — which is overwhelmingly ticks and candles — so it cannot be synchronous at all. Events go into a bounded queue and another thread writes them.
Bounded means it can overflow, and what happens then is the good part: it drops, counts what it dropped, and writes a marker file recording that the day was lossy. A journal that silently loses events under load is worse than no journal, because you would later reconstruct a timeline from it and reach a confident wrong conclusion. Recording the loss makes the gap visible to whoever reads it — and, as Chapter 20 noted, an evidence bundle refuses to be produced at all if a drop marker exists in its window.
There is one more decision worth naming because it applies to both: a failed journal write logs an error and the session keeps trading. The journal is an audit control, not a trading dependency. A full disk must not become a trading outage — although it should become an alert, which is the next section.
Watching the thing that watches#
Disk space is a good example of the shape operational monitoring takes here, because the failure is so slow and so total.
A live daemon that fills its volume stops writing journals, stops persisting state, and stops being able to recover — while holding open positions. That is not a degradation, it is an outage with money exposed. And it arrives gradually over weeks, which is exactly the kind of failure nobody notices until it completes.
So a guard watches free space and alerts against a floor, well before the cliff. It has hysteresis — having fired, it does not re-arm until free space recovers comfortably past the floor — because a volume hovering at the threshold would otherwise alert on every single check, and an alert that fires constantly is an alert nobody reads.
Journals get retention with a similar practical wrinkle: old files are compressed and eventually deleted, but the most recent days are always left uncompressed, because an in-flight evidence capture or parity replay reads that recent window and should not have to decompress a file that is still being written.
Running is not the same as working#
Here is the observability problem specific to trading systems, and it is subtler than it sounds.
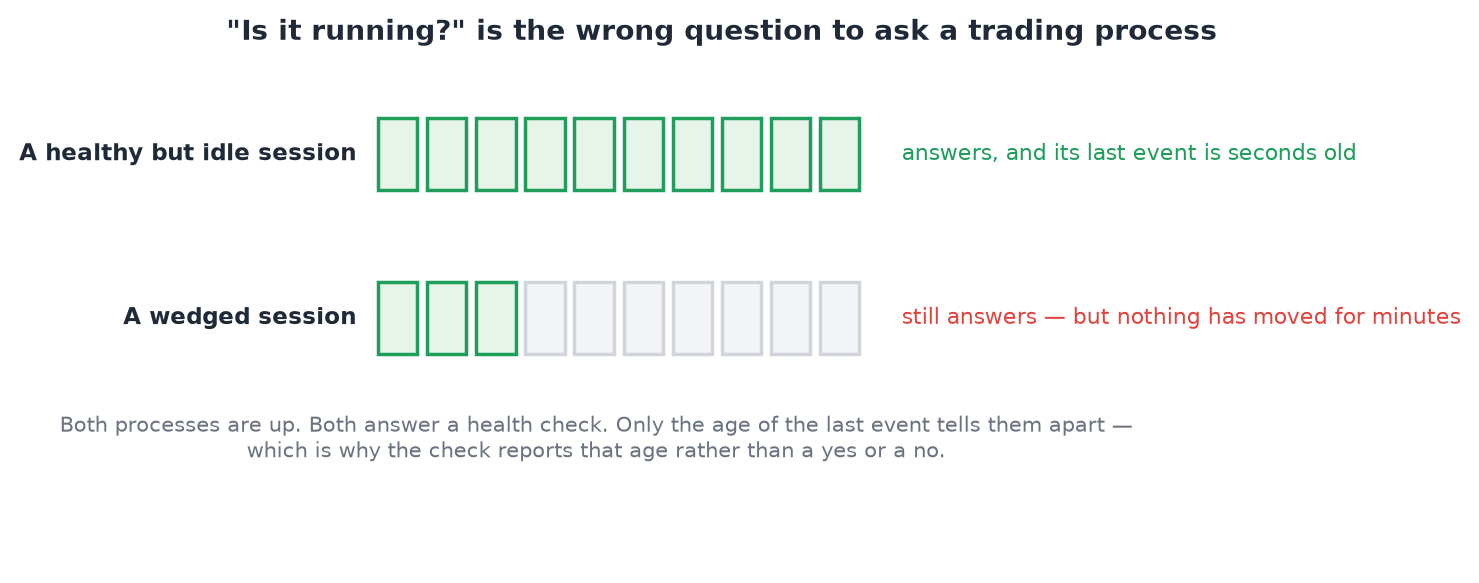
Figure 22.2 — a process check cannot tell these apart. Only the age of the last event can.
A trading session that is completely wedged — engine thread dead, queue growing, nothing being processed — still responds to a health check. The process is up. The port answers. Every ordinary liveness probe says healthy.
And a session that is perfectly fine on a quiet Sunday looks identical: no trades, no fills, nothing happening.
The distinguishing signal is the age of the last event, reported per strategy. A healthy idle session has recent events, because ticks and heartbeats keep arriving even when nothing is traded. A wedged one does not. The health endpoint therefore reports that age rather than a boolean, so an external watchdog can make the distinction that “is the process running” cannot.
For an operator, the same information comes back through a command whose exit code is the alert:
$ qkt status --deep

qkt: HEALTHY

DAEMON       running (uptime 3d4h)
CONTROL      reachable
STRATEGIES
  momentum-btc         running, 42 trades, up 3d4h
Exit zero when everything is healthy, non-zero with the reasons on stderr when it is not.
Because the exit code carries the verdict, the check composes with ordinary tooling — a cron entry that pages on a non-zero exit turns the whole health surface into a monitor without any integration work.
Alerts that behave when the world misbehaves#
Notifications go out to a chat channel, and the retry policy has one distinction worth borrowing.
When the delivery service replies rate limited, the notifier waits and retries without consuming a retry attempt. When it replies with a transient or network error, the attempt is consumed and after three the message is given up on.
The distinction is that rate limiting is not a failure — it is the service explicitly saying ask again shortly. Treating it as a failure would burn the retry budget on the one condition that is guaranteed to resolve, and then drop the message that was going to succeed.
An authentication failure is treated differently again: it permanently degrades the notifier for the life of the process. A bad token will not start working, so retrying it forever only produces noise and consumes capacity other alerts need.
Worth noting the channel is bidirectional. The same connection that delivers alerts also accepts operator commands — halt, resume — gated on the chat identity. Which is convenient at 3am and is also, honestly, a control surface whose security rests on that one check.
Collecting the evidence#
When something has gone wrong and the answer is not obvious, there is a command that bundles the evidence:
$ qkt incident collect --strategy momentum-btc --since 2026-09-01
qkt incident collect: wrote incident-momentum-btc-20260901.zip
Two details in how it builds that bundle are worth having.
It filters journal lines by time as it streams them into the zip, rather than loading files and slicing them — so collecting a one-hour window from a week of journals does not require holding a week of journals in memory on a machine that is already unhappy.
And when a file exceeds the size cap, it keeps the tail, not the head. For triage, the last ten megabytes of a log are worth vastly more than the first ten, because the thing you are investigating happened recently. The manifest records the truncation so nobody mistakes a cut file for a complete one.
The manifest also embeds hashes of the exact config and strategy files that were bundled, which ties the evidence to a provable version — the same instinct as Chapter 20’s attestation, applied to a support ticket.
Paying for the evidence#
What it bought is that “what exactly happened, in order” has an answer, that a wedged session can be distinguished from a quiet one, that a disk filling up is a warning weeks ahead rather than an outage, and that gathering the evidence is one command rather than an archaeology project across three directories.
What it cost is real overhead on the hot path — a durable append per order event, a queue offer per bus event — accepted because the alternative is having nothing to read when it matters.
And there are honest gaps. The metrics endpoint exposes uptime, trade counts and notifier health, but not latency percentiles: those are reachable only through the status command, so the numbers the next chapter builds cannot currently be scraped into a dashboard or alerted on automatically. The instrumentation exists and its most useful consumer does not. That is worth knowing rather than assuming, and it is the kind of gap that only shows up when someone tries to build the dashboard.